Google Scholar
A more comprehensive list of completed projects can be referenced from Google Scholar (scholar.google.com/citations?user=EGtd_noAAAAJ&hl=en).
Particle Impact on Surfaces
|
Aircraft often have to operate in locations that may have large quanties of sand or dust in the air. This is especially true when considering the takeoff of aircrfat in regions of the world where concrete runways and landing pads may be uncommon. Unfortunately, the ingestion of this dust damages the aircraft engine and makes it less sustainable in use. This work is focused on characterizing how ingested dust damage the internal components of gas turbine compressors.
The most common strategy for quantifying this effect is a configuration such as demonstrated below. A gas jet that is laden with particles is fired at a solid surface, a so-called coupon. The coupon test can be used to study surface erosion, particle boucing dynamics, and other relevant phenomena for predicting the damage in gas turbines. |
Multi-scale Simulations of Turbulent Spray
Spray are a common flow with applications in combustion, heat transfer, and chemical processing. Although most real flows are turbulent, there is currently a lack of understanding of turbulent multiphase flows. For spray, the problem is worse due to the large range of scales present between the smallest droplets and the large spray core. This work uses a multi-level simulation strategy to develop high-fidelity, physics based models of spray turbulence.
|
|
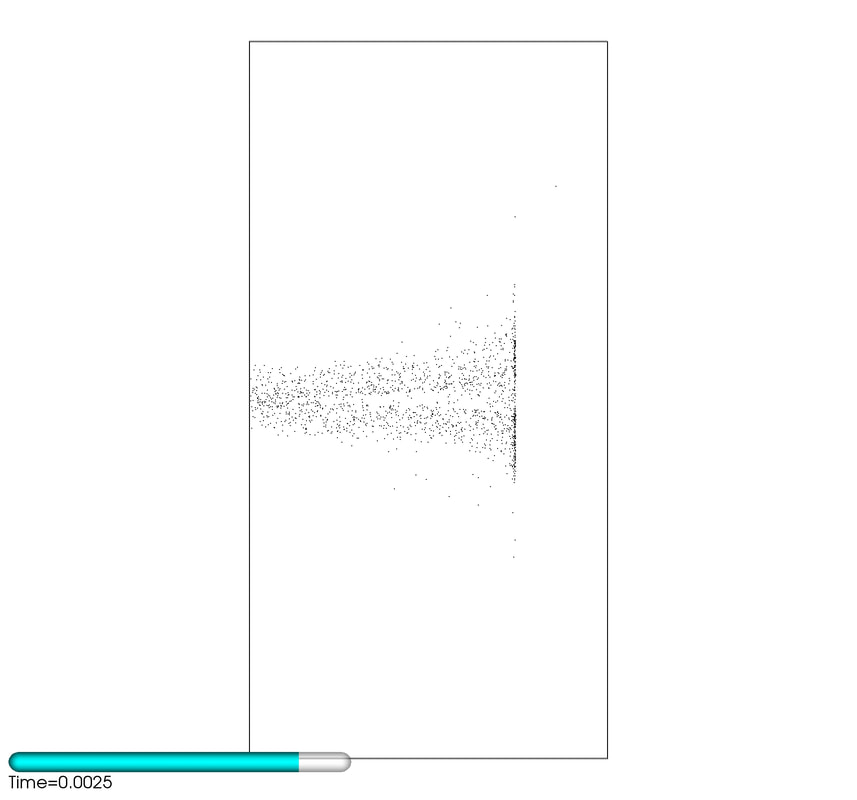
At the macro-scale, simulations of spray in realistic configurations are performed using a Euler-Lagrange approach. In this method, the droplets are modeled as discrete particles whose dynamics are governed by ODEs. The motion of the gas phase is simulated using high resolution techniques such Large Eddy Simulation or Direct Numerical Simulation.
The images on the left demonstrate a vaporizing spray injected from a cylindrical pipe with a gaseous co-flow. The droplets are visualized as black particles. Initially the domain is free of both droplets and fuel vapor. As the droplets enter the domain, they vaporize and a cloud of vapor forms around them. Because the droplets vaporize as the are injected, they do not fully penetrate the domain. |
|
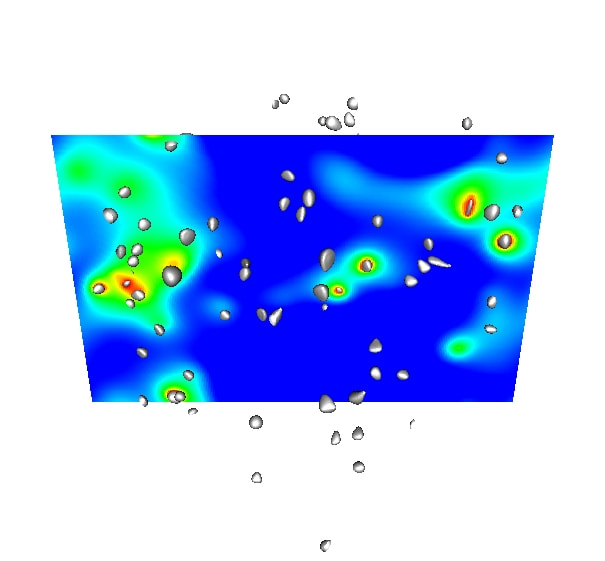
At the micro-scale, Direct Numerical Simulations (DNS) have recently matured enough to study fuel vaporization and combustion from first principles. Using only the principles of conservation of mass, momentum, and energy, simulations can be used to deliver detailed data on the evolution of the thermo-fluid flow. This places DNS in a unique position to study the micro-scale interactions between combustion, fuel vaporization, and turbulence.
The image on the right shows fuel droplets evaporating in a turbulent flow field. The droplets are represented by gray contours, while the colors represent the amount of evaporated fuel. (The fuel vapor mass fraction has been taken on a 2D slice of the domain.) It can be seen that droplets undergo significant variations in their shape due to the straining motions of the turbulent fluid flow. The distribution of vapor in the air is highly influenced by both the the proximity to droplets and the local nature of the flow topology. |
|
Interfacial Surface Area Evolution in Turbulence
Bubbly flows are common for many chemical engineering processes. One such process is in gas-to-liquid thermochemical conversion. In these flows, the rate of thermochemical conversion and the quality of the product is ultimately limited by the size of the interface between the gas and liquid phases. As such, predicting the size and evolution of the interface is paramount. Since most real flows are turbulent, interface evolution in turbulence is the canonical test bed for these problems.
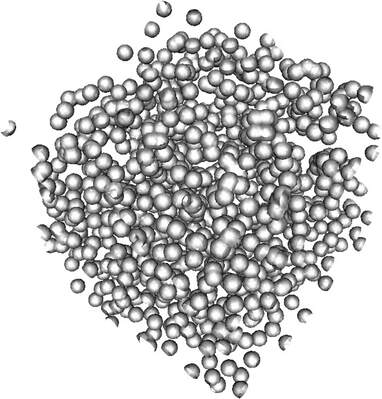
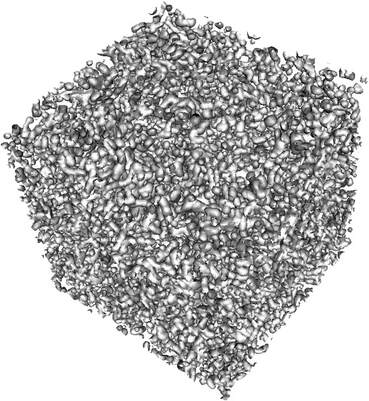
The images below demonstrate the early stages in the evolution of the bubble surface in a turbulent bubbly flow. Here, each bubble is initially spherical and represented by a gray contour. As the turbulent flow progresses, the bubbles break into small structure of irregular shape, thus introducing additional interfacial surface area.
The images below demonstrate the early stages in the evolution of the bubble surface in a turbulent bubbly flow. Here, each bubble is initially spherical and represented by a gray contour. As the turbulent flow progresses, the bubbles break into small structure of irregular shape, thus introducing additional interfacial surface area.
|
|
